Peter Viola - Enhancing Log Parser Reports with Charts
When you need quick analysis of your traffic logs you won’t find an better tool than Microsoft’s free Log Parser. With Log Parser you can read a variety of log files including the Registry and Windows event logs. It’s ease of use comes from using SQL queries against your log file. You can get your data even faster by using multiple log parser queries in a batch file.
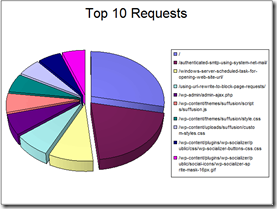
The other day I was helping someone who needed some “top 10” data from their site’s log. Since I had these in my trusty batch file I could provide the text reports within seconds. However, I like to offer a little more pizzazz when possible so this time I decided use Log Parser’s native charting capability to output the results with some nice charts. As the saying goes a picture is worth a thousand words.
Here’s the query I used to create the chart above:
logparser.exe -i:iisw3c "select top 10 cs-uri-stem, count(*) into top10requests.gif
from <file> group by cs-uri-stem order by count(*) desc"
-o:CHART -chartType:pieexploded3d -categories:off -chartTitle:"Top 10 Requests"
Command line driven charts via one of my favorite tools. Think "Manager Safe Log Reports..." (Oh, wait, I've been a manager... well, then I guess I should know! ;)
Related Past Post XRef:
Log Parser Studio 2.0 now out (Log Parser GUI++)
Log Parser Studio - Think "Log Parser GUI" Or "Making Log Parser click-click fun and easy to use..." or "Query Analyzer for Log Parser"
Learning Log Parser Studio in two parts... (From Install to Library Ninja)
Log Parser Ping Graph Fun (aka “Using Log Parser to parse command line output”)
SELECT * FROM Log... with the cool tool that’s been around for years, Log Parser!
Download details: Log Parser 2.2
The Unofficial Log Parser Support Site
IIS Diagnostics Toolkit (January 2006)
SQL Server 2000 Report Pack for IIS Logs


0 comments:
Post a Comment